Approach
A stress testing approach is used within the context of an "Iterative Closed Question Modelling" method. That is, possible futures are described in terms of complete model scenarios (with selected model structure, parameter values and input values). This "model scenario space" is divided in terms of the answer the model scenario provides to a pre-defined question (a "normative boundary"), and whether the model scenario is considered plausible (an "epistemic" boundary"). Both boundaries can change as the analysis progress.
Stress testing is approached similarly to hypothesis testing. The answers to a pre-defined question are treated as hypothetical conclusions. Each of those conclusions is tested by looking for plausible model scenarios that support the conclusion. If you can find a plausible scenario, then the conclusion is plausible. If, despite your best efforts, you cannot find a plausible scenario, then that conclusion is not plausible.
Case study details
The problem tackled involves assessment of the impact of a streamflow regime. Within the broader closed question of “Will objectives be achieved under the anticipated streamflow regime?”, a hypothetical situation is created where regular flooding is required to sustain a wetland, and the resulting closed question “Will regular flooding of ecological assets occur?” is answered by generating model scenarios using a simple model of a daily flow duration curve.
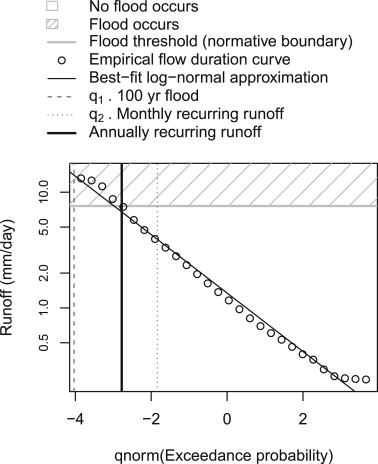
The model is an approximation of an empirical flow duration curve. The two parameters q1 and q2 define a 100yr flood and monthly recurring runoff, respectively. The primary objective is whether the annual flow exceeds a flood threshold.
Eight techniques are used to identify plausible model scenarios that respectively show that flooding and does not occur.
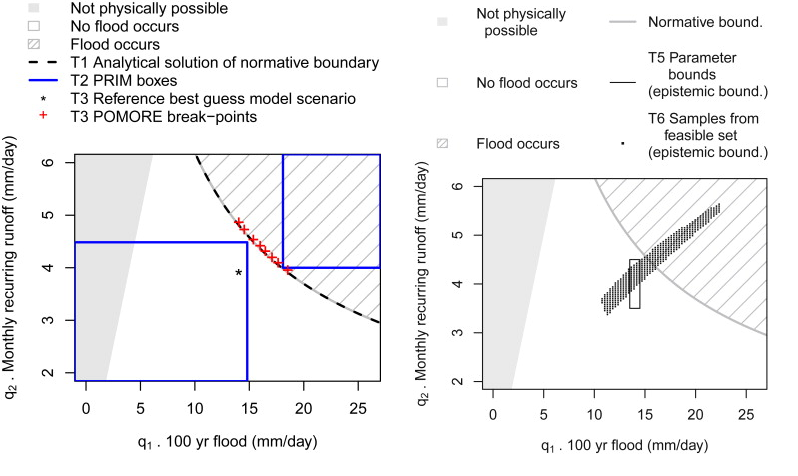
- T1 Vulnerability analysis directly partitions the model scenario space (in this simple case it is possible analytically)
- T2 Scenario discovery identifies "boxes" in parameter space using PRIM as implemented in sdtoolkit
- T3 Breakpoint analysis identifies scenarios on the boundary between flooding occuring or not, using POMORE to identify scenarios closest to a reference best guess model scenario
- T4 (not shown here) involves creating model scenarios where flooding does and does not occur based on narratives.
- T5 Defining parameter bounds involves specifying bounds on which parameter values are plausible based on prior knowledge.
- T6 A "set membership" approach involves keeping only parameters where the error is less than a threshold
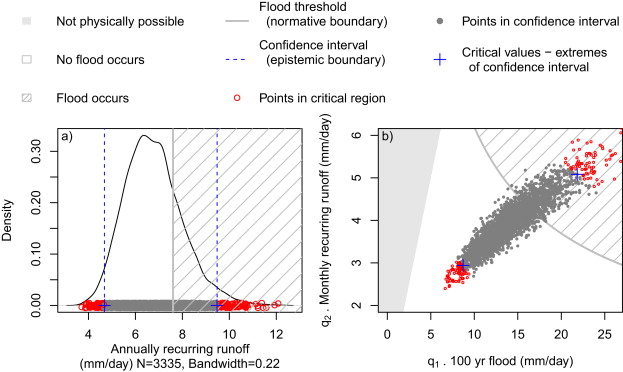
T7 statistical uncertainty analysis includes three equivalent approaches
- T7a Using "confidence intervals", model scenarios are considered acceptable if their output falls within the confidence interval
- T7b Testing "critical values", checking whether flooding occurs in the corresponding model scenarios.
- T7c The "p-value" is calculated as the likelihood that flood occurs.
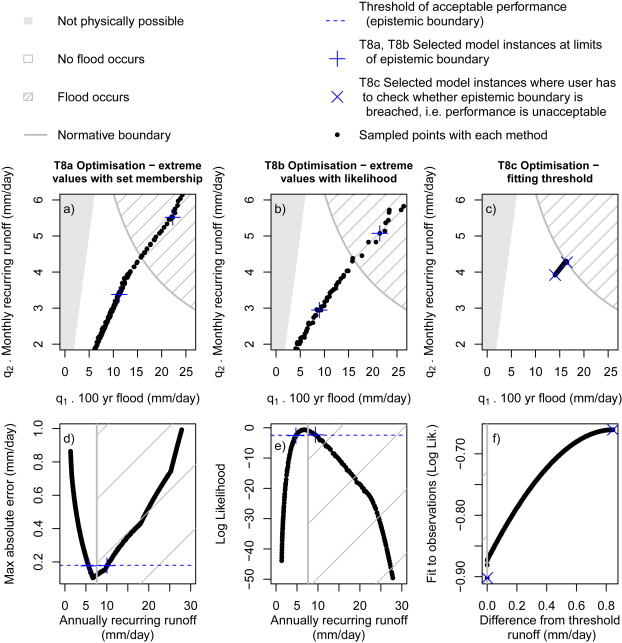
T8 Optimisation-based hypothesis testing includes three variants:
- T8a and T8b use optimisation to identify model scenarios that respectively minimise and maximise the value of a quantity interest, while maximising a measure of performance, namely likelihood (T8a) or maximum absolute error (T8b)
- T8c identifies model scenarios that maximise fit to observations and maximise fit to an observation in which objectives are only just met. The model scenario in which objectives are only just met will be on the boundary, and will be considered plausible if the reduction in fit to observations is considered acceptable.
Reference
- Guillaume JHA, Kummu M, Räsänen TA, Jakeman AJ (2015) Prediction under Uncertainty as a Boundary Problem: A General Formulation Using Iterative Closed Question Modelling. Environmental Modelling & Software 70: 97–112. doi:10.1016/j.envsoft.2015.04.004
- I2Insights blogpost summarising the Iterative Closed Question Modelling approach to making predictions under uncertainty.
- Code for these examples is provided on Github